By Scott Lyon
After nine years of painstaking work, an international team of researchers on Wednesday published a precise map of the vision centers of a mouse brain, revealing the exquisite structures and functional systems of mammalian perception.
To date, it is the largest and most detailed such rendering of neural circuits in a mammalian brain.
The map promises to accelerate the study of normal brain function: seeing, storing and processing memories, navigating complex environments. As importantly, it will deepen the study of brain disorders in anatomical and physiological terms — that is, in terms of the wiring and the relationships between circuits and signals. That’s especially promising for disorders that may arise from atypical wiring, such as autism and schizophrenia.
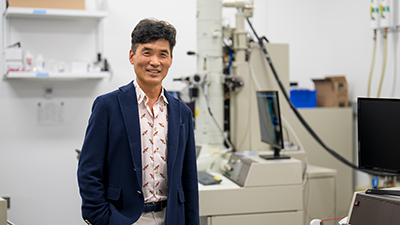
“The technologies developed by this project will give us our first chance to really identify some kind of abnormal pattern of connectivity that gives rise to a disorder,” said Princeton University’s Sebastian Seung, the Evnin Professor in Neuroscience and a professor of computer science, who co-led the project.
The work was published in a raft of papers on April 9, comprising a special edition of the journal Nature.
Along with Seung’s Princeton team, the consortium was co-led by teams at Baylor College of Medicine and the Allen Institute for Brain Science. In total, more than 150 researchers from 22 institutions worked on the project. It was primarily funded by the U.S. Office of the Director of National Intelligence and the National Institutes of Health.
NIH representatives have cited this work as foundational to the future of health, disease and disorder. The intelligence office’s stated interest is “to reverse engineer the algorithms of the brain” for use in next-generation machine learning techniques, according to a government website. Mammalian brains are much more efficient than computers at using small amounts of data to make complex decisions, for example. This map represents a new way to study how they do it.
Matching form and function in the brain
“The brain is this biological tissue inside our heads that makes us see the world, have feelings, make decisions,” said Andreas Tolias, a neuroscientist who co-led this project, then from Baylor, now at Stanford University.
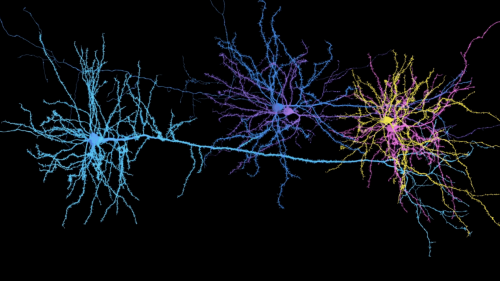
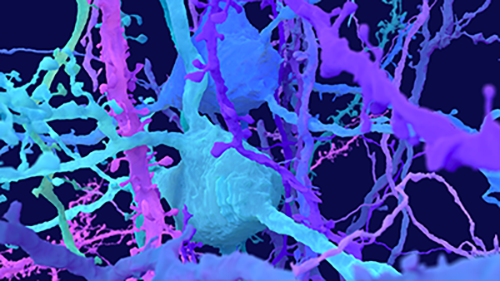
In making the map, the researchers digitally disentangled tens of thousands of individual treelike neurons, traced each neuron’s distinct system of branches, then reconstructed them one by one into a vast network of circuitry — what scientists call a connectome.
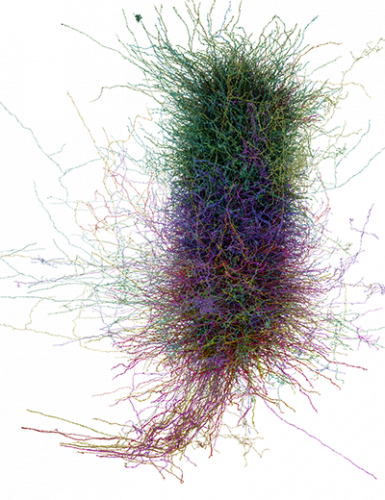
The result includes more than half a billion connections across one cubic millimeter of brain tissue, including the primary visual cortex.
“What is unique about this data is that it brought, in one experiment, both the structure and the function together,” Tolias said.
The mouse was shown short video clips while hooked up to a sophisticated imaging system. With this system, the researchers tracked the animal’s brain activity patterns by measuring the presence of calcium ions, indicating the flow of information.
They wanted to know not only how that activity is organized in the brain but also how the activity is related to the underlying cells and their connections.
Walking the path
To acquire this data, the researchers needed the mouse to be awake and visually stimulated. So they had the animal run on a treadmill while watching dynamic 10-second scenes, clips from The Matrix, Mad Max: Fury Road, the Qatsi experimental documentary trilogy, and various extreme sports including motorcross, base jumping and luge.
The mouse was then sent to the Allen Institute, where researchers sliced the brain into about 28,000 vanishingly thin layers. The researchers used an electron microscope to make images of each of those slices, then reconstructed the images into a composite.
Seung’s team then applied artificial intelligence to trace every contour of every neuron through these tens of thousands of slices, coloring them in to illuminate them individually, a process called segmentation. That AI-generated segmentation process must then be validated, or proofread, by humans. A major portion of the diagram has been proofread, but the work continues.
The resulting unified view of the connectome and its activity makes the technology extremely powerful. Scientists from the consortium have already made some surprising findings in the relationships between neurons, the preferences of specific neuron types, and how these features influence higher-order functions.
“We think these things are just the tip of the iceberg,” Tolias said.
They’ve also used data from this project to create high-fidelity digital models of the mouse brain, known as a digital twin, that can be used to probe new questions and develop subtle hypotheses that can then be validated in a lab.
Thomas Macrina worked in Seung’s Princeton group as a graduate student, earning his Ph.D. in neuroscience and computer science over the course of this project. Seung and Macrina have since launched a company called Zetta AI that performs some of the most painstaking parts of the connectome mapping process for research groups — aligning the images, tracing the neurons’ many branches, and proofreading the results.
Macrina said that, because of the work done on the mouse project, the methods have become much faster and more efficient over the last several years. Scientists are now mapping the connectomes of multiple species, from mosquitoes and flies to macaques and humans. As these tools become more widely available, they promise to accelerate discoveries across the entire field of neuroscience, enabling researchers to ground their functional and behavioral studies in the physical realities of neural circuits.
“Every neuroscience experiment should in some ways be referencing a connectome,” Macrina said.
The digital transformation of brain science
Writing in Scientific American, in 1979, the leading biologist of his era, Francis Crick, suggested that technological innovators in neuroscience should focus on achieving attainable goals. “It is no use asking for the impossible, such as, say, the exact wiring diagram for a cubic millimeter of brain tissue and the way all its neurons are firing.”
His words served as a challenge.
Seung compared the broader impacts of mapping the human connectome to the Human Genome Project’s transformation of genomics. Before that project, completed in 2003, humanity did not know basic information, like the number of genes a person has or the genetic similarity between people.
Two decades later, genomics lies at the forefront of medicine, personalizing treatments for breast cancer and leukemia and helping doctors fine-tune the dose of blood thinners, for example.
“The connectome is the beginning of the digital transformation of brain science,” Seung said. “With a few keystrokes you can search for information and get the results in seconds. Some of that information would have taken a whole Ph.D. thesis to get before. And that’s the power of digital transformation.”
Of course, there are key differences between the genome and the connectome. Namely, where the genome can be written on a single line using sequences of a four-letter alphabet, the brain is a morass of tangled fibers that process information in real time on an extremely small energy budget.
While the transformation of brain science could prove to be even more breathtaking than that of genomics, it will also take more effort and creativity to pull off.
“The connectome is not necessarily the neural code,” Tolias said. He said that while understanding the brain’s structures in fine detail is essential to understanding how it works — and immediately important for studying disease — answering the biggest questions about attention and cognition will require a deep understanding of the brain’s software too.
From nematode sex to subjective human experience
Starting small has enabled scientists to build a suite of techniques and technologies that have allowed them to lever up to bigger and more complex brains. The complete connectomes of both adult sexes of the nematode worm C. elegans were completed in 2019. Last year, a team, also co-led by Sebastian Seung at Princeton, released the complete connectome of a fruit fly. Many of the researchers who worked on that project also worked on the mouse. In fact, many of the key approaches developed and refined to study one animal were used to study the other, and vice versa.
The dataset for the mouse brain is entirely public, meaning researchers across the globe have already started using it to test theories and develop new ways of looking at the brain.
One cubic millimeter of mouse brain is about 20 times bigger than the complete fruit fly brain, and much more complex, but the new map is far from a complete rendering. It represents only about one-one thousandth of a whole mouse connectome.
The leap from partial mouse connectome to full human connectome will take time, resources, and a level of ingenuity that can sometimes seem impossible. Then again, the current map seemed impossible just a few decades ago. Indeed, the researchers said, Francis Crick’s assessment still seemed more or less accurate when the current team started in 2016.
In many ways, one of the key findings to emerge from this project is proof that mapping connectomes is valuable in the first place.
J. Alexander Bae, who earned his Ph.D. jointly in electrical engineering and neuroscience, and who worked for many years on this project, said the idea of tracing hundreds of thousands of cells and assembling them into a full 3D reconstruction was truly audacious at the time.
They faced a lot of skepticism from fellow scientists. Most of the hard work had to be done by hand. And they had to invent many of the tools to complete the job.
“We could have failed,” Bae said. “But if we failed, this field of connectomics could have just collapsed.”
Instead, connectomics is on the verge of explosive growth.
“I’m in awe,” Bae said.
With each increase in size and complexity, scientists discover new techniques, invent new technologies, and solve new problems that yield yet larger and more complex results, which can be probed anew.
“It’s just a beginning,” Seung said. “But it’s opening the door to a new era of realistic brain simulations. And so the next question becomes – and people will ask – can that ever be done with a human brain? And then the next question is, well, even if you could simulate a human brain, and it was very faithful, would it be conscious?”
When asked what he thought about it, he laughed. “I don’t have any more authority to make a statement on that than you do. But when people say, I don’t believe a simulation of a brain would be conscious, then I say, ‘Well, how do you know you’re not a simulation?’”
The flagship paper, “Functional connectomics spanning multiple areas of mouse visual cortex,” by The MICrONS Consortium, appears in a special issue of Nature devoted to the mouse connectome, published April 9 (DOI: 10.1038/s41586-025-08790-w). The work was supported by the Intelligence Advanced Research Projects Activity (IARPA) via Department of Interior/Interior Business Center (DoI/IBC) contract numbers D16PC00003, D16PC00004, D16PC0005 and 2017-17032700004. The National Institutes of Health also provided grant support (NIH/NINDS U19 NS104648, NIH/NEI R01 EY027036, NIH/NIMH U01 MH114824, NIH/NIMH U01 MH117072, NIH/NINDS R01 NS104926, NIH/NIMH RF1 MH117815 and NIH/NIMH RF1 MH123400 to H.S.S.; NIH/NINDS U19 MH114830 to A.T.; and NIH U24NS120053 and NIH 1RF1MH128840-01 to R.C.R.). The National Science Foundation supported the work via NSF CAREER grant IOS-1552868 to X.P., NSF NeuroNex 2 award 2014862 to R.C.R., and NSF NeuroNex grant 1707400 to X.P. and A.T. Additional support came from the Mathers Foundation, Google, Amazon and Intel.