 Percolation
What are the goals of this assignment?
Should I implement the union–find data structures from scratch?
No, use the versions in algs4.jar.
On some assignments (such as this one), you will apply classic algorithms and data
structures (from the textbook) to solve interesting problems.
On other assignments (such as the next one), you will implement
fundamental algorithms and data structures from scratch.
Both are important skills.
Can I add (or remove) methods to (or from) the Percolation
or PercolationStats APIs?
No. You must implement the APIs exactly as specified, with the
identical set of public methods and signatures (or you will receive a substantial deduction).
However, you are encouraged to add private
methods that enhance the readability, maintainability, and modularity of your program.
Why is it so important to implement the prescribed API?
It is an essential component of modular programming,
whether you are developing software by yourself or as part of a team.
When you properly implement an API, others can write
software to use your module or to test it.
We do this regularly when grading your programs. For example,
your PercolationStats client should work with our
Percolation and vice versa. If you add an extra public
method to Percolation and call it from PercolationStats,
then your client won’t work with our Percolation.
Conversely, our PercolationStats client may not work with your
Percolation if you remove a public method.
How thoroughly must I test my code?
For each program, you must include a main() method that unit tests the class.
At a minimum, the main() method must not only call each public constructor
and method directly,
but it must also help verify that they work as prescribed (e.g., by printing results to standard output).
How many lines of code should my program be?
You should strive for clarity and efficiency. Our reference solution for
Percolation.java is about 80 lines, plus a test client.
Our PercolationStats.java client is about 60 lines.
After the system has percolated, PercolationVisualizer
colors in light blue
all sites connected to open sites on the bottom (in addition to those connected to open sites
on the top). Is this “backwash” acceptable?
Yes. While allowing backwash does not strictly conform to the Percolation API, it requires
quite a bit of ingenuity to fix. It is extra credit if you are able to implement a solution
that meets the performance requirements and has no backwash.
% java-algs4 PercolationVisualizer input10.txt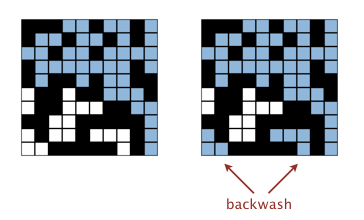
What should stddev() return if T equals 1?
The sample standard deviation is undefined. We recommend returning Double.NaN
but we will not test this case.
How do I generate a site uniformly at random among all blocked sites?
Pick a site at random—use StdRandom to generate two
integers between 0 (inclusive) and n (exclusive)—and use this site
if it is blocked; if not, try again and repeat until you find a blocked site.
I don’t get reliable timing information when n = 200. What should I do? Increase the size of n (say to 400, 800, and 1,600), until the average running time exceeds its standard deviation.
I don’t get reliable timing information even when n is large.
What should I do?
Try executing with the -Xint flag.
The% java-algs4 -Xint PercolationStats 200 100 ...
-Xint flag turns off various compiler optimizations,
which helps normalize and stabilize the timing data that you collect
(albeit, at the expense of making your program substantially slower).
Testing.
We provide two clients that serve as large-scale visual traces.
Use them for testing and debugging your Percolation implementation.
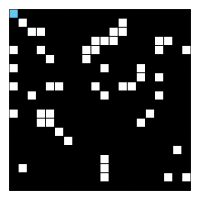
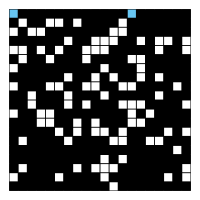
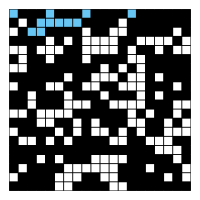
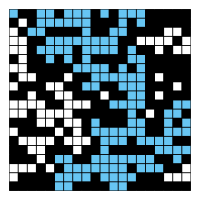
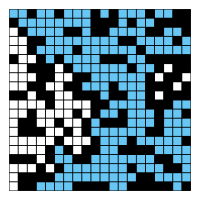
Visualization client. PercolationVisualizer.java animates the results of opening sites in a percolation system specified by a file, performing the following steps:
   % more input20.txt
   20
    6 10
   17 10
   11  4
    8  4
    4  8
    0  0
   ...

% java-algs4 PercolationVisualizer input20.txt
| 
| 
| 
| 
|
Sample data files.
The file percolation.zip contains
sample data files for use with the visualization client.
Associated with most input .txt files is an output .png
file that contains the
desired graphical output at the end of the visualization.
InteractiveVisualization client.
InteractivePercolationVisualizer.java
is similar
to the first test client except that the input comes from a mouse (instead of from a file).
It takes a command-line integer n that specifies the grid size.
As a bonus, it writes to standard output the sequence of sites opened in the same format used by
PercolationVisualizer, so you can use it to prepare interesting files for testing.
If you design an interesting data file, feel free to share it with us and your classmates by posting it
in the discussion forums.