Laboratory #3: Capacitive (and Related) Sensors
Care and Feeding of Interface Boards and Sensors
Please be cautious with wiring, and especially connecting batteries. Connecting a battery backward, only for a
moment, can fry many components. Be careful with the wires connected to the sensors,
as they can break off.
What to touch
Nothing in this lab can hurt you, unless you're
allergic to something nobody else is. Don't, however, touch any bare
wires when running experimental trials (it's ok to touch them when
setting up things of course). Hold the devices by the insulation on
the wires, not on the soldered connections (if exposed).
The Parallax Basic Stamp II
For some of the hardware labs, we'll be using the Basic Stamp II from Parallax Inc.
It's pretty cool for doing quick interface circuits, but
sort of dumb from a programming perspective. It's also sort
of slow compared to some processors (but so are many human motions).
1. The RC Time Constant, using a capacitor to measure an FSR
Here we'll use the circuit shown in Figure 2-1:
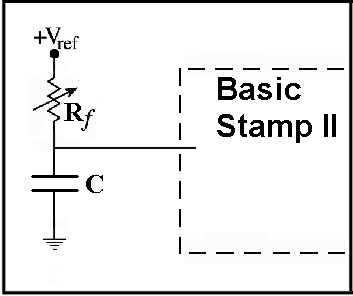 |
| Figure 2-1: Pressure FSR Measurement Circuit |
Procedure:
- Connect one wire of the round FSR to the red terminal on the interface board.
- Connect one wire of the green capacitor to the black terminal.
- Connect both of the remaining wires (one from the FSR, one from the capacitor) to the B0 terminal.
- Load the RC-time program for the Basic Stamp II.
Questions:
- Is the output a function of how hard you press?
- What is the numerical range of the sensor circuit?
- Note, while pressing and releasing a number of times, the minimum
and maximum value for the FSR. Which is for maximum pressure and which is
for minimum? Does this make sense given what you know about the
resistance as a function of pressure, the circuit, and the RC time
constant? (Please say more than "yes" here or you won't get any points).
2. Measuring capacitance
Procedure:
- Replace the green capacitor in the above circuit with the orange
capacitor.
(one cap wire to black, one FSR wire to red, other two wires to B0).
Questions:
- Squeeze and release the FSR some and note the minimum and maximum values. How do these
relate to the min and max values for the green capacitor?
- If I state that the green capacitor is 0.022 microfarads, then estimate
the capacitance value of the orange capacitor.
- Do notice anything about the time required to do the RCtime
function vs. how hard you're pressing the FSR? Why might this be?
Could this be bad for any reason? Can you comment on some situations
where this could introduce difficulties?
3. You have capacity too!
Procedure:
- Disconnect any sensors/capacitors from the terminals.
- Connect a 10MegOhm resistor (little brown cylinder thing with
Brown,Black,Blue,Silver(or Gold)
stripe pattern) between the red and the B0 terminal.
- Load and run this slower RC time program (just a longer pause between acquisitions)
Questions:
- Alternately touch and release the B0 terminal with your finger. Do you see any difference in the displayed value? What are the min and max values?
- If I say that the base capacitance of the untouched terminal is 0.0001 microfarads,
then what is the capacitance with your finger added into the circuit?
- Delete the debug statement in the PBasic program, and replace it with:
if myword < 100 then nopress
debug "Hi!! "
nopress:
What happens when you touch and release the B0 terminal?
Describe some possible applications of this most wonderful circuit.
4. Piezo sensor
Procedure:
- Remove any sensors, resistors, etc. from the interface board terminals.
- Connect the red wire of the Piezo sensor to the red terminal.
- Black wire to black terminal.
- Other wire to the A0 terminal.
- Load and Run this A/D code
Questions:
- Is the output a function of how hard you press? Can you tell?
- How fast can you tap the sensor and see the effects?
- Is it a function of how hard you tap it? Can you tell?
- Let the sensor rest and note the values coming out. Now
lay a quarter on the sensor and note the values.
Comment on this sensor's usefulness for measuring constant pressure, vs.
changing pressure or tapping.
Procedure:
- Load and Run this new A/D code
- Tap and press the sensor a number of times, tap as fast and hard as
you can.
Questions:
- What's the min and max you were able to get the A/D to read?
- Comment on this code versus the last, and what this might mean.
Procedure:
- Load and run this other A/D code
- Clear the debug window by pressing the "clear" button.
- One partner hold the reset button, while another holds
the piezo sensor flat on the table (don't touch the sensor, just
hold it firmly down by the wires.
- Have the reset button partner say "go" as they release the button.
- While the data acquisition goes on, tap the piezo sensor in
a random pattern (like di dahhh di di di duh di dup, )where the
different vowels are durations)). You might have to do this a couple
of times to get a few good randomly spaced taps in during the trial.
Remember to press the "clear" button before each run.
- Grab and copy all the text in the debug window using Control-C.
- Save it in a file.
- Run MATLAB, cd to your file, and load it:
> x = load('myfile')
- Plot it:
> plot(x)
Questions:
- Can you see in the plot how you tapped the pattern on the sensor?
- What are the minimum and maximum values in the plot?
(Note you can do this using the matlab max and min functions).
- How much noise is there between taps? (make up your own way of
quantifying and describing this).
- Modify the code to print out the word "Bang" when you bang on
the Piezo sensor (see section 3. above). Include a listing of your entire
"Bang" program with your lab report.
5. Accelerometer
Procedure:
- Disconnect any sensors or whatever from the terminals of the interface board.
- Load and run this Accelerometer Program
This program uses the PulseIn function to read the accelerometer.
- Turn the board on it's side so that it is directly vertical relative
to the ground (or the desk), and the battery is now sticking straight up.
Note the output values.
- Lie the board flat on the table. Note the output values.
- Turn the board vertical the other direction. Note the output values.
- Load and run this Accelerometer Program
- Clear the debug window by pressing the clear button.
- Press and hold the reset button.
- Release the reset button and shake the interface board pretty
vigorously back and forth (along the side to side axis, not the length
axis).
- Grab the text in the debug window and save it in a file.
- Run MATLAB, load and plot the data you just saved.
- Find and note the min and max values from the data
Questions:
- What were the down, rest, and up values?
- What were the min and max values?
- The rest value corresponds to zero gravities (Gs)of acceleration.
The down and up values correspond to 1 and -1 Gs.
Given that, how many Gs maximum positive and negative did your
shaking induce?
- Could you use this device to track head tilt?
- Go back and take measurements for flat, 45 degrees, and 90 degrees,
-45 degrees, and -90 degrees tilt.
Plot these values, number vs. tilt.
Is it linear? Why (or not)?
If not, come up with a function that converts the PulseIn numbers
to tilt in degrees.
Procedure:
- Disconnect all batteries before leaving the lab!
And finally.....
- Practical HCI system thought problem: Pick two of the sensors/systems
you've looked at in this lab, and describe a new and novel computer
application. Draw a block diagram of the system, sketch a user using
it, and describe a simple test you might run to evaluate the performance
of this new system.
CS436:
Human-Computer Interface Technology, Princeton University, Autumn 2005
Authors: Perry Cook
Copyright © 2002-5, Princeton
University