Write a program to estimate the value of the percolation threshold via simulation. The primary goal of this assignment is to introduce you to basic tools for understanding the effect of algorithm performance on completing a typical programming task.
Install Std* libraries. If you have not already done so, download StdDraw.java, StdIn.java, StdOut.java, StdRandom.java, and StdStats.java from http://www.cs.princeton.edu/introcs/home/programs.php.
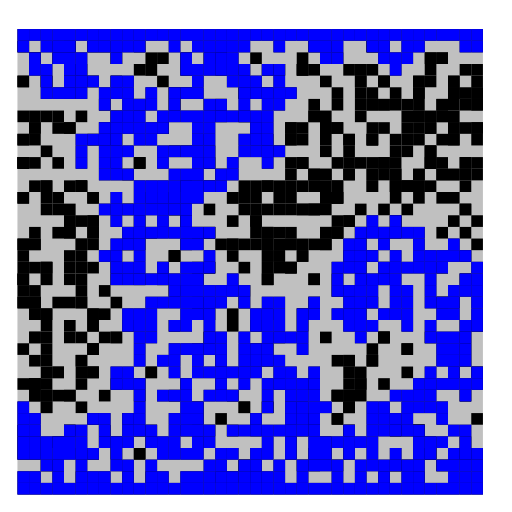
Percolation simulation. The code Percolation.java which uses QuickU.java is your starting point. It fills (declares vacant) random squares in an initially empty grid until the top row is connected to the bottom row, using the quick-union algorithm to detect connectivity. Your first task is to modify this code to display all of the vacant squares that are connected to the top (or bottom) via a chain of vacant squares in blue, all other vacant sites in black, and all occupied sites in gray, as in this picture.
Name the resulting program PercolationVisualizer.java. The purpose of this visualization is to serve as a large-scale trace to make sure that your code works on reasonable-sized inputs. Knowing that it works properly for a 20-by-20 grid gives some confidence that it works for a 200-by-200 grid.
Initial experiments. The running time of PercolationVisualizer.java is dominated by the graphics, so your next task is to remove the graphics calls to get a program PercolationStats.java that can run experiments to produce an estimate for the percolation threshold. Then modify the program to do multiple experiments:
Improved union-find implementations. Substitute implementations of weighted quick-union and weighted quick-union with path compression, and run the same experiments as above. Use the code from the booksite. Observe the comparative performance characteristics of the three algorithms. Which is fastest? Why? Which is slowest? Why?
Deliverables. Submit PercolationVisualizer.java and PercolationStats.java. Finally, submit a readme.txt file and answer the questions.